This was an interesting project that I’ve worked on before. I was wondering how to kickstart my inner blogging motivation for a long time, then I’ve remembered this project.
It was actually a side project given to me during my first working student job. At the same time I was also working on my thesis, hard times.
Problem
Think about the kitchen of a well-known fastfood restaurant chain. There is a camera mounted on top somewhere, directed towards a burger broiler machine. A broiler machine is basically an oven with a conveyor belt. Raw burger patty in, cooked burger patty out.
Problem is: We need to count how many burgers this machine process during the day in an automatic way.
A worker periodically puts one or multiple stack(s) of frozen burgers. Then, this machine takes the bottom one from each stack, with a metal rod on the conveyor belt. Think that like drawing a card from a deck, but in this case the deck is a stack of burgers and finger is the metal rod, and it takes the card from bottom of the deck. See Video 1 for example:
Video 1: Problem definition. Notice the moving metal rod of conveyor into the broiler.
As the Video 1 shows, speed of this metal rod is not constant, it varies according to the number of orders. Left and right trays are independent, let’s say we count only the left side for now.
With each full upwards motion of the metal rod (i.e. one conveyor cycle), machine takes one burger from each stack, therefore we can formulate the problem as following:
count = 0
for each conveyor cycle:
   count += number of burger stacks
To solve this problem, we need two things to do: detect each conveyor cycle and detect number of burger patty stacks.
Metal rod detection
In order to detect a full motion of metal rod, first we need to know where it is in each frame. That’s why we need a ‘metal rod detector’ first.
For this, I’ve experimented with a lot of techniques, like template matching, sobel filter, etc..
I’ve ended up with the following pipeline with a customized FFT filter + OTSU thresholder to estimate the pixels belonging to the metal rod.

Figure 1: Metal rod location detector pipeline
In order to get the vertical location of metal rod, I’ve accumulated the number of white pixels in horizontal bins, then convoluted that with a basic gaussian filter for noise reduction. At the end, the location of the max value (argmax) means the vertical location of the metal rod.
Conveyor cycle detection
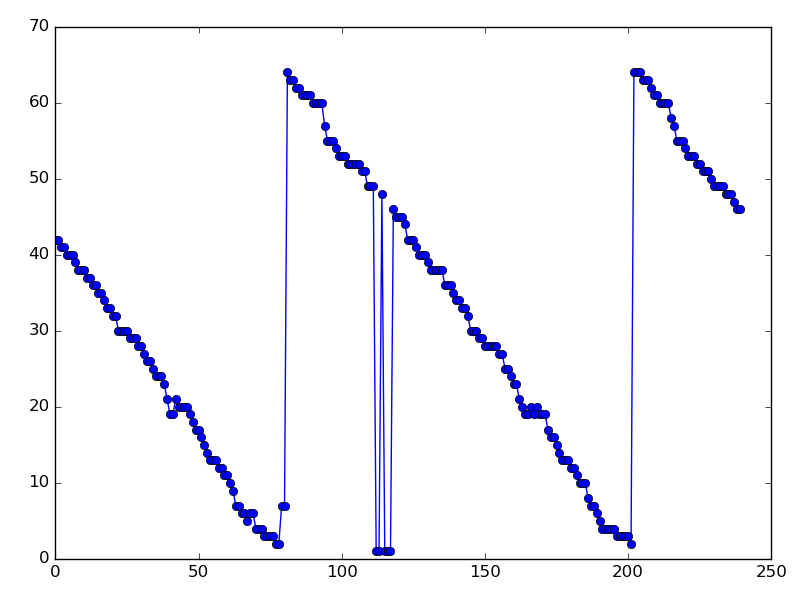
Now, if we plot the location of the metal rod over time, we can see a pattern. Figure 2 shows the metal rod location/time of the empty tray. Don’t worry about the decreasing way of the signal, it’s because row numbers grow through the lower parts of the image. Figure 2: Metal rod location over time
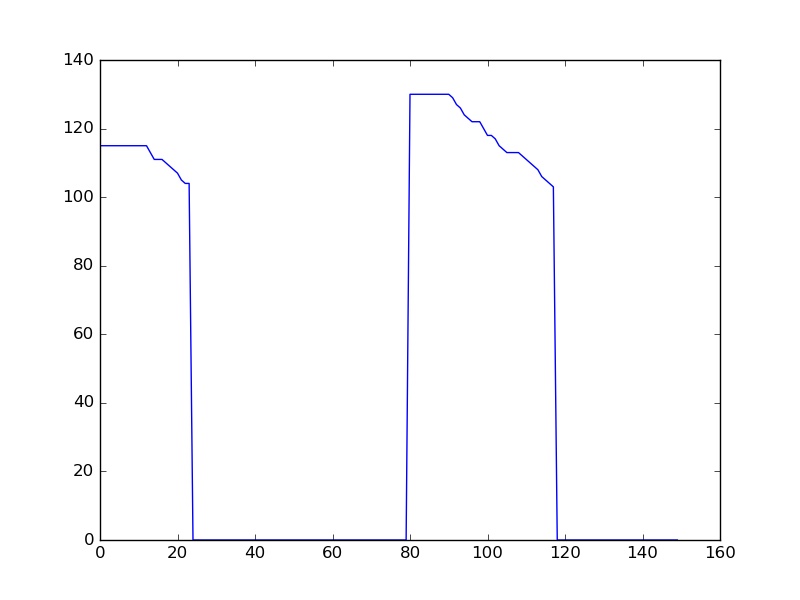
This signal becomes much more noisy when there is some stack of burgers, therefore I’ve manually adjusted the metal rod detector to operate only on the lower side of tray, and also applied median filter to further reduce the noise down. The resulting signal looks something like this in Figure 3:

Figure 3: Metal rod location over time, after some adjustments
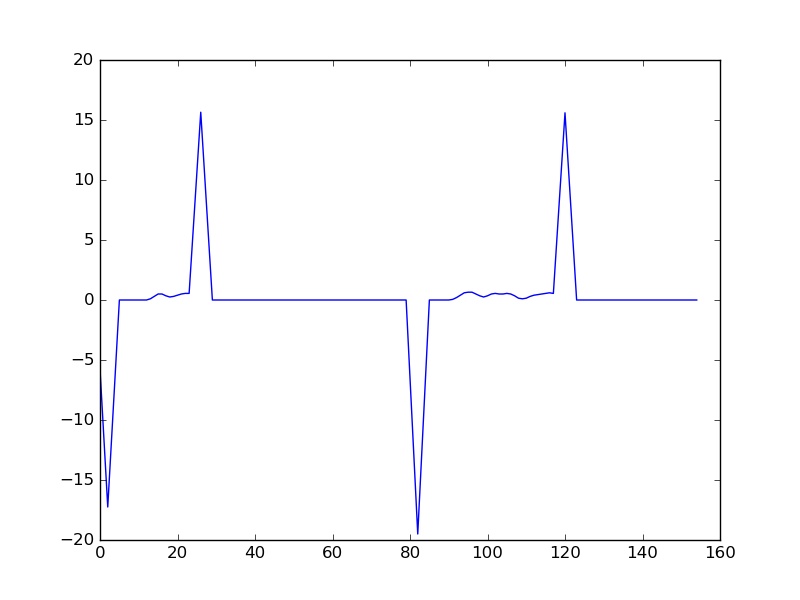
It’s clear that a full downward cycle of metal rod in the signal = metal rod goes into the machine = machine takes some patties inside. To detect the downwards trend of metal rod location, I’ve applied cross correlation with a down sawtooth wave, which results the signal in Figure 4.
With this, now we can detect each conveyor cycle, since each peak represents one cycle of the conveyor metal

Figure 4: Cross-correlated metal rod signal, each peak means one full cyle of metal rod
Burger patty stack detection
We need to detect number of patty stacks, because we increase the total count by this value for each conveyor cycle. This was again some trial and error with various methods that I don’t remember right now. Ended up with this following pipeline in Figure 5. I’ve used OpenCV’s already existing blob detector at the end.

Figure 5: Burger patty stack count detection pipeline
Final result
Patty stack detector runs for every frame as well. After some median filtering of this signal, and combining it with the conveyor cycle detection signal, we can now have the complete burger patty counter. Check out the Video 2 for the final result.
Video 2: End result
In the Video 2, bottom left show the patty stack counter. Bottom right is the metal rod location detector. Top right shows the combined detectors, where red signal is the patty stack count over time, blue signal is the conveyor cycle detector. Yellow signal is the total number of patties inserted into the machine.
In each peak of the blue signal, total count is incremented by the current value of patty stack count. So that’s one way to count number of pattties inserted into a broiler machine.
Conclusion
This was a really interesting project for me, I’ve learned a lot during and had a lot of fun. Unfortunately I cannot share the code of this - if I were able to, it wouldn’t be much useful anyway, because it was such a mess. But, I can say that I’ve used python and openCV. I’ve created the detectors as separate threads and also created another thread for combining the information.
Feel free to contact me about the details, or about any questions